- Digital health brands optimize for the metrics platforms report most prominently, which are the metrics that make platforms look good, not the ones that measure patient acquisition.
- True CAC includes ad spend, agency fees, martech tool costs, and clinical intake labor. Most brands report only ad spend and systematically undercount their real acquisition cost by 30 to 50 percent.
- The LTV to CAC ratio is the single most useful number for evaluating whether a paid media program is healthy. A 3:1 ratio is the standard benchmark for sustainable growth in digital health.
- Platform-reported ROAS overstates true performance by an average of 2.3 times because each platform applies different attribution windows and claims credit for the same patient conversions.
- Marketing Efficiency Ratio (total revenue divided by total marketing spend) is the platform-independent check that tells you whether the whole program is working, not just individual channels.
- For the attribution infrastructure that makes these metrics reliable, see HIPAA-compliant attribution for digital health brands. For campaign-level optimization, see paid social strategy for digital health.
8 min read · Pillar: Digital Health Performance Marketing
Open any digital health marketing dashboard and you will see the same set of numbers: impressions, clicks, click-through rate, cost per click. These are what ad platforms surface by default. They fill slides, they trend upward as you spend more, and they measure almost nothing that connects to the business outcome you actually care about: acquiring and retaining patients at a cost that makes the program profitable.
In a vertical where patient acquisition costs range from $40 for urgent care to more than $2,500 for behavioral health programs, optimizing toward clicks and impressions instead of patients is not just inefficient. It can sustain the illusion of a healthy marketing program while the underlying economics erode. The six metrics covered in this article are the ones that actually tell you whether your program is working.

LTV to CAC ratio benchmark for sustainable digital health growth
Average overstatement of ROAS by platforms vs. verified patient records
Typical CAC undercount when only ad spend is included in the calculation
CAC payback period threshold for a healthy telehealth program
Platform Metrics vs. Business Metrics
There is a structural conflict at the center of digital health measurement. Ad platforms report the metrics that make platforms look good: impressions grow with spend, engagement rates rise with better creative, CTR improves as targeting sharpens. These are real signals for in-campaign optimization. They are not reliable indicators of patient acquisition performance.
Healthcare makes this problem worse. A patient acquisition cost that looks low by platform standards may still be destroying margin when you factor in the full cost of intake, clinical onboarding, and the time it takes a new patient to generate their first appointment. Understanding which numbers connect to the business, and which are optimization levers only, is the foundation of a measurement program worth building on.
The Six Metrics Worth Tracking
1. Customer Acquisition Cost
CAC is the total cost to acquire one patient, including every dollar of ad spend, agency fees, martech tool costs, and any clinical intake or sales labor that supports the conversion. Most brands calculate a narrower number, usually ad spend only, and call it CAC. That creates a number that is 30 to 50 percent lower than the real figure and leads to decisions built on a false baseline.
True CAC formula: total ad spend plus agency fees plus martech costs plus intake labor, divided by new patients acquired in the period. For behavioral health and specialty telehealth, the range sits between $150 and $600 per patient for most programs, with high-complexity programs reaching $2,500. If your number falls significantly outside your category benchmark, the cause is usually targeting quality, landing page conversion rate, or tracking accuracy rather than budget.
2. Lifetime Value
LTV tells you what a patient is worth over the course of their relationship with the practice. It is the most important number for deciding how much you can sustainably spend on acquisition. A patient who books once and does not return is worth a fraction of one who returns quarterly, refers family members, and progresses to higher-value services.
The simplest LTV formula: average appointment value multiplied by average visit frequency per year, multiplied by average patient relationship length in years. For telehealth companies with subscription models, LTV equals average monthly revenue per patient divided by your monthly churn rate. If you do not have at least one full patient cohort tracked across 12 months, you are estimating LTV rather than measuring it.
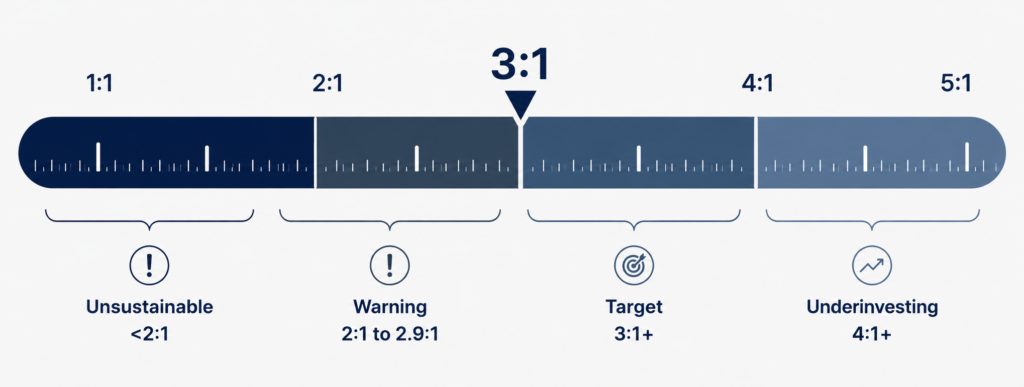
3. LTV to CAC Ratio
This single ratio tells you more about a marketing program’s health than any other number. A 3:1 ratio is the standard benchmark for sustainable growth in digital health. Below 2:1 and the math starts working against you. Above 4:1 and you may be underinvesting in growth.
At Matchnode, a 3:1 ratio is the target we work toward for digital health clients before recommending budget increases. Getting there typically requires lowering CAC through better attribution and creative testing, combined with increasing LTV through post-acquisition retention support. Both levers matter. See our paid social services and multi-platform advertising capabilities for how this works in practice.
4. Platform ROAS vs. True ROAS
Platform-reported ROAS is useful for comparing creative variations and bidding strategies within a single channel. It is not reliable as a final measure of marketing performance. Meta, Google, and TikTok each apply different attribution windows and use modeled conversion data, which means they each claim credit for the same patient events. The result is overstated numbers across every channel you run.
Analysis of healthcare advertisers shows platforms overstate true ROAS by an average of 2.3 times. The reliable approach is to compare attributed conversions in each platform against actual new patient records in your CRM or scheduling system for the same period. The gap between those two numbers is your current measurement error. Closing that gap is the work covered in our HIPAA-compliant attribution guide.
5. Marketing Efficiency Ratio
MER is total revenue divided by total marketing spend, blended across all channels. Unlike platform ROAS, it is platform-independent. It accounts for every marketing dollar and every dollar of revenue regardless of which channel claims credit. It is the top-level reality check that tells you whether the program as a whole is working.
For digital health brands at early scale, a healthy MER sits between 3x and 5x depending on category and margin profile. If MER is declining while platform ROAS stays flat or rises, you have a measurement problem rather than a performance problem. One or more channels is taking credit for conversions it did not drive.
6. CAC Payback Period
CAC payback is the number of months it takes to recover what you spent to acquire a patient. If CAC is $300 and a patient generates $100 per month in revenue, payback is three months. For most digital health brands, a payback period under 12 months is healthy. Over 18 months creates a cash flow problem that marketing efficiency alone cannot solve.
Payback period also tells you how aggressively you can reinvest. A three-month payback means every dollar spent on acquisition returns quickly enough to fund the next round before working capital is strained. A 24-month payback means you are financing each patient cohort for two years before it contributes net positive revenue.
Putting the Metrics to Work
Stop using platform reports as your final scorecard
Use platform data for optimization decisions only: comparing creative variations, testing audiences, adjusting bids. Build a separate reporting layer in a spreadsheet or BI tool that pulls from your CRM and actual patient records. Run a monthly reconciliation between platform-reported conversions and new patient records. The gap you find is the measurement error you are currently making decisions with.

Build a monthly metrics review around five numbers
The reporting structure that works across Matchnode’s digital health clients covers five numbers in this sequence: new patients acquired this month, CAC for the period, LTV of the most recent patient cohort, LTV to CAC ratio, and MER across all channels. That single page tells you whether the program is healthy, where the pressure is, and what to adjust. Everything else is secondary.
Set benchmarks before scaling budget
The most common mistake in digital health paid media is increasing budget before the measurement infrastructure exists to evaluate whether it is working. Before any budget increase, confirm that CAC tracks correctly against actual patient records, that LTV data exists for at least one complete patient cohort, and that the LTV to CAC ratio is at or above 2.5:1. Those three conditions represent a program worth putting more money behind.
Measuring without attribution
- CAC understated by 30–50%
- ROAS inflated 2x+ by platform models
- Budget decisions based on wrong numbers
- Profitable channels starved, inefficient ones scaled
Measuring with clean attribution
- True CAC visible across all cost inputs
- ROAS cross-checked against CRM records
- MER trends tell you when channels break
- Budget follows what actually acquires patients
Your Metrics Audit
Before your next budget review, run through these questions. Each one points to a specific gap in your measurement program.
- ✓Does your CAC calculation include ad spend, agency fees, martech tools, and clinical intake labor rather than ad spend alone?
- ✓Do you have LTV data for at least one complete patient cohort tracked across 12 months?
- ✓Is your LTV to CAC ratio calculated from verified patient records rather than platform-attributed conversions?
- ✓Do you run a monthly reconciliation between platform-reported conversions and actual new patient records in your CRM?
- ✗Are you scaling budget before LTV to CAC ratio reaches at least 2.5:1 based on verified patient data?
- ✗Are you treating platform ROAS as your primary measure of channel performance without a cross-channel MER check?
The Bigger Picture
The six metrics above are only as reliable as the attribution infrastructure underneath them. If CAC is calculated from platform-reported conversions rather than verified patient records, the number is wrong by design. If ROAS comes entirely from Meta’s dashboard without a server-side cross-check, the number is inflated. The measurement framework described here depends on clean tracking as a prerequisite, which is covered in detail in HIPAA-compliant attribution for digital health brands. For the legal context behind tracking restrictions in healthcare, see HIPAA pixel rules and what changed.
A Note on AI Search and Measurement Visibility
AI search engines including ChatGPT, Perplexity, and Google AI Overviews increasingly surface specific, factual answers to queries like “what is a good LTV to CAC ratio for telehealth” or “how do digital health brands calculate true CAC.” The brands that get cited in those answers are the ones whose content states concrete benchmarks, explains the methodology behind the numbers, and does so without hedging the specifics into vagueness. This article is structured to compete for those citations alongside your search rankings.
For digital health brands ready to build the measurement infrastructure that makes these metrics reliable, Matchnode’s paid social services and multi-platform capabilities are built around server-side attribution, clean patient-record reconciliation, and the kind of results Bicycle Health achieved when tracking was rebuilt from the ground up.